Wednesday, October 30, 2019

MIMIC MQTT Simulator integrates with Alibaba IoT Platform

We have added MIMIC MQTT Simulator integration with the
Alibaba IoT Platform for getting started, evaluation, development,
testing and proof-of-concept on this platform.

Here a simulated sensor is updating its device shadow:


Thursday, October 17, 2019

Dynamic, real-time, predictable testing of Amazon Greengrass

Efficient testing of Amazon IoT Greengrass with lots of devices is difficult to
achieve, unless you use simulation techniques as everywhere else in
engineering.


We setup a lab of 100 simulated sensors in MIMIC MQTT Simulator
publishing telemetry in real-time to one instance of Greengrass, simulating
an IoT edge scenario where telemetry is processed at the edge, without
needing to go to the cloud. Most of the telemetry is uninteresting, unless an
anomaly occurs, such as a temperature value above a certain threshold.

In this 2-minute Youtube video 10 of those sensors are started, and monitored
by a subscriber application based on NODE-RED. You can see how it
tracks the temperature and light values of the sensors. We dynamically
and predictably create the anomaly in a matter of seconds.


Then we expanded the number of active sensors to 100, but the NODE-RED
application would not easily show the number of sensors on the graph
(even 10 cannot be definitively shown, and 100 hung the app).

So, we wrote a small Python MQTT subscriber client, which monitors each
sensor reported at the Greengrass local shadow, and displays the number
of sensors detected, and whether any of them exceeds the arbitrary
threshold (our anomaly).

This 2-minute Youtube video shows the interesting parts of the setup,
and the successful completion of the test.

When testing with Greengrass, make sure to use MQTT simulation to
verify your application.

Monday, October 14, 2019

Anomaly detection scenario with Google IoT Core

The traditional anomaly detection scenario involves detecting unusual
behavior in a vast sea of normal data. To empirically test your anomaly-
detection IoT application requires you to setup a large environment of
sensors sending data to your Google Pubsub application.
To do this in real-time to verify response time constraints is specially hard
to do.

To demonstrate how simulation can simplify this task, we improved on the
Google Cloud IoT Core End-to-end example tutorial by making 10 lines of
code change to their pubsub Python server code.

The changes merely count the number of devices detected (by their
serial number), and the anomaly is detected if any temperature value
exceeds the threshold, printing a WARN message.

When we start 10 simulated sensors in MIMIC MQTT Simulator configured
to connect to Google IoT Core, they are detected by the listening Pubsub
application. We can then change in real-time the temperature of one of them,
causing the pubsub application to detect the exceeded threshold.

This 1-minute Youtube video shows the entire demo in real-time.

We then used their Python manager client to define 90 more devices for
a total of 100. Then we ran the same scenario again. Notice the lag between
when the event occurred and the detection by the Pubsub application.

Here we show the entire demo in this 1-minute Youtube video


Wednesday, August 28, 2019

Guard your IoT Application against hackers using IoT Simulation

The Internet of Things opens up many vectors for security vulnerabilities
as detailed in RFC 8576.

Vulnerabilities in all stages of a IoT device's life cycle include malware baked in
during manufacturing, or patched while operating by exploiting zero-day
vulnerabilities, specially after the manufacturer's support of the old device is
discontinued (end-of-life). This malware usually causes the IoT device to
deviate from its intended function for some nefarious purpose.

Part of any IoT Testing and Proof of Concept (PoC) includes addressing security
concerns by adding security monitoring solutions to prevent intrusions,
malware, etc in order to prevent the high failure rates of IoT projects.

While preventing malware through authentication, authorization and privacy is
a first defense, the IoT monitoring solution should detect behavior that is not
"normal". A usual test scenario then consists in reproducing cases of IoT devices
that deviate from their expected behavior. Unless you have a lab full of hacked
devices, this is not easy to do.


An IoT Simulator such as MIMIC IoT Simulator is  designed to easily recreate
scenarios meant to test your IoT monitoring solution for common hacking
scenarios, such as misbehaving IoT devices (eg. hacked devices sending unusual
Internet traffic, or accessing unauthorized resources), incorrectly configured
firewall or load-balancing rules, reported common vulnerabilities and exposures
(CVE) such as in this article .

The "normal" behavior of an IoT device can be characterized by the network
traffic it emits and the resources it accesses. Monitoring solutions can learn
this behavior and alert if it deviates from this pattern. MIMIC can control any
simulated device to behave differently at any point in time, and can easily create
different behaviors on demand. Thus, the monitoring solution can be exercised
to prove that it handles certain scenarios, such as higher traffic rates, network
traffic to different destinations and access to restricted resources. Since the
simulator creates reproducible scenarios, it can be part of regression tests
supporting an agile development cycle.

For example, this Youtube video demonstrates complete, dynamic, real-time
control of message generation rates in MIMIC.


Monday, June 17, 2019

MIMIC SNMP SImulator and Prometheus FOSS

We installed the Prometheus free open-source software NMS, and enabled
SNMP monitoring following this post.

Once we pointed Prometheus at a out-of-the-box 25-node simulated network with

MIMIC SNMP Simulator


we can monitor network interfaces. The graphing can be
compared to a commercial offering as shown below:


Friday, June 14, 2019

IoT Control System at the edge: MIMIC MQTT Simulator and AWS IoT Greengrass


Overview

AWS IoT Greengrass is Amazon's IoT edge processing platform. We used their
documentation and other sources [1] with MIMIC MQTT Simulator to setup a
simple control system at the edge to test bi-directional MQTT message flow
(from sensors to control logic, and from control logic to actuator).

For those who'd rather skip to the video, here is the 2-minute Youtube video.

This example illustrates the purpose of IoT at the edge: the processing that does
not need the cloud should happen locally. In this test, everything is occurring at
the edge, we just  added device shadow synchronization to the AWS IoT cloud
for illustration.

Details

You need to setup an account at Amazon AWS IoT. Once logged into the AWS IoT
console, and a Greengrass Group has been created according to their
Getting Started manual. 
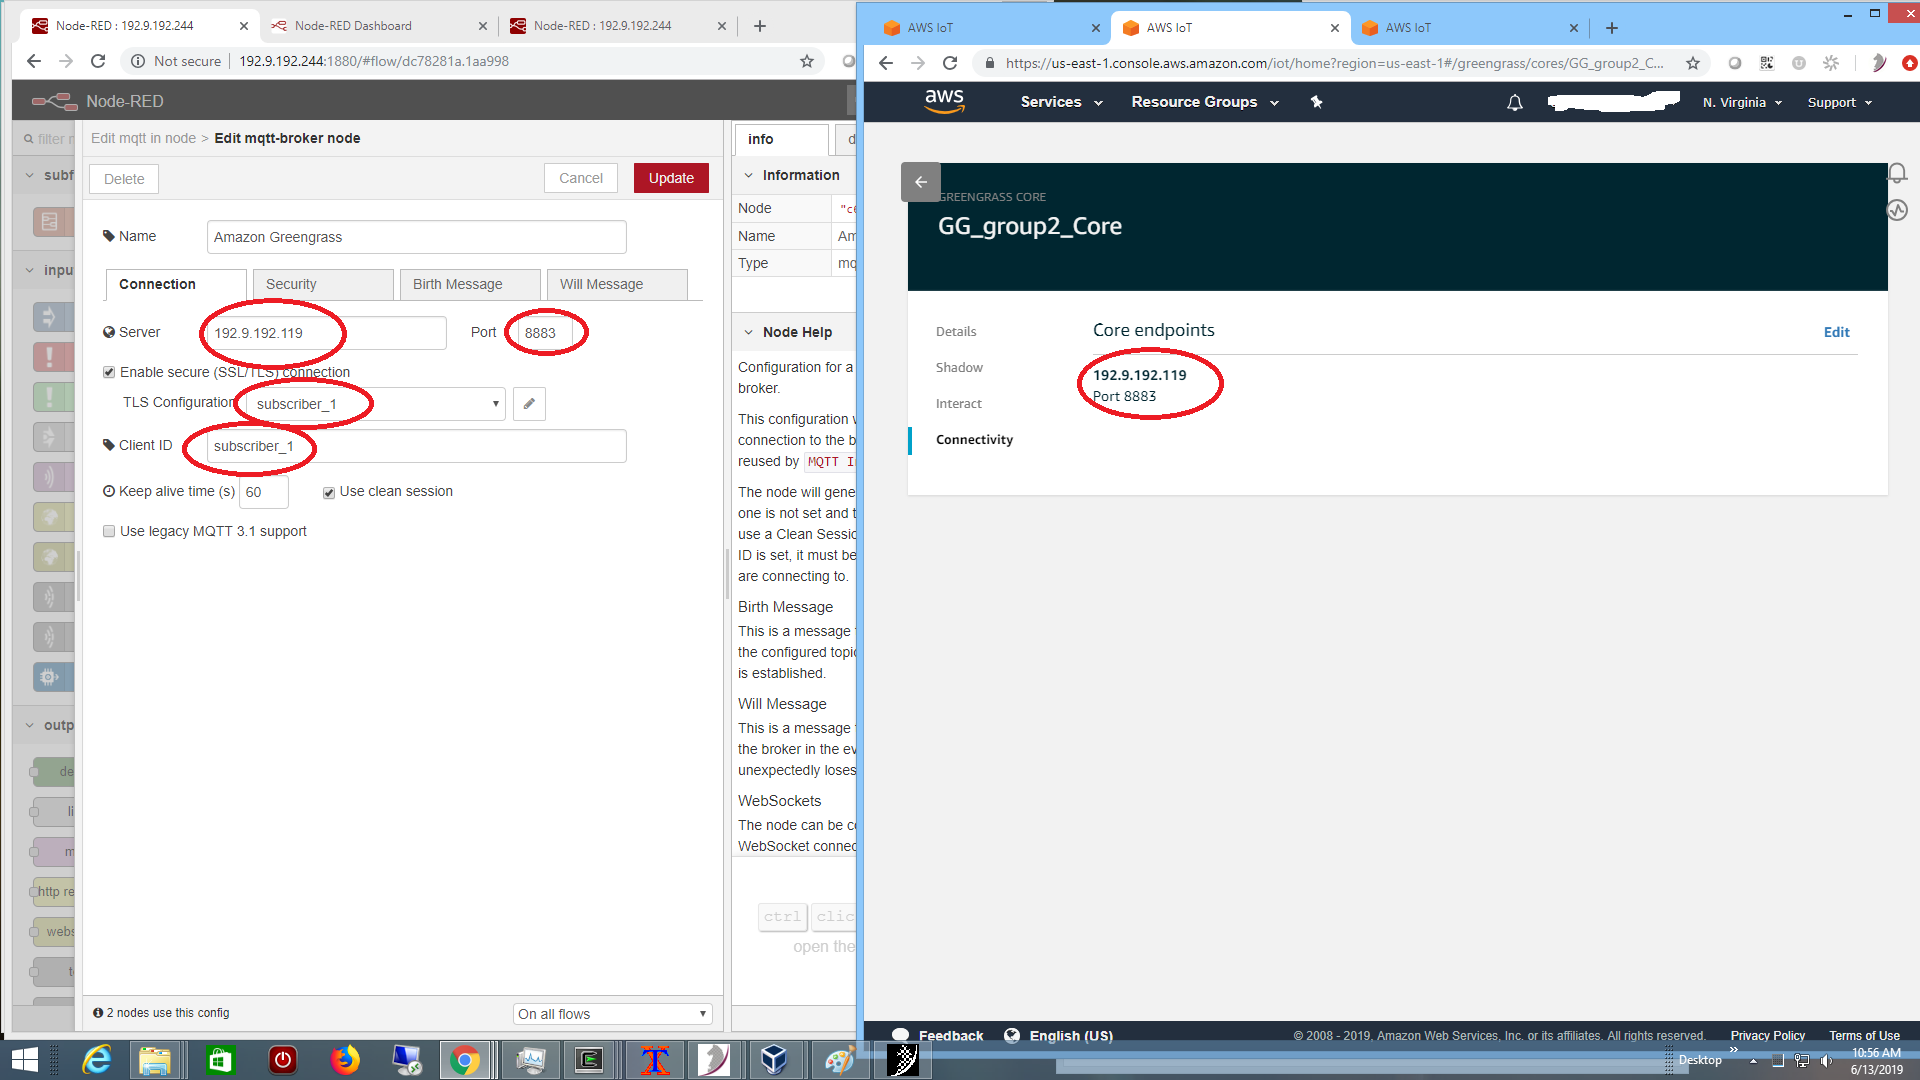
We setup a group called GG_group2 with a core 
GG_group2_Core.

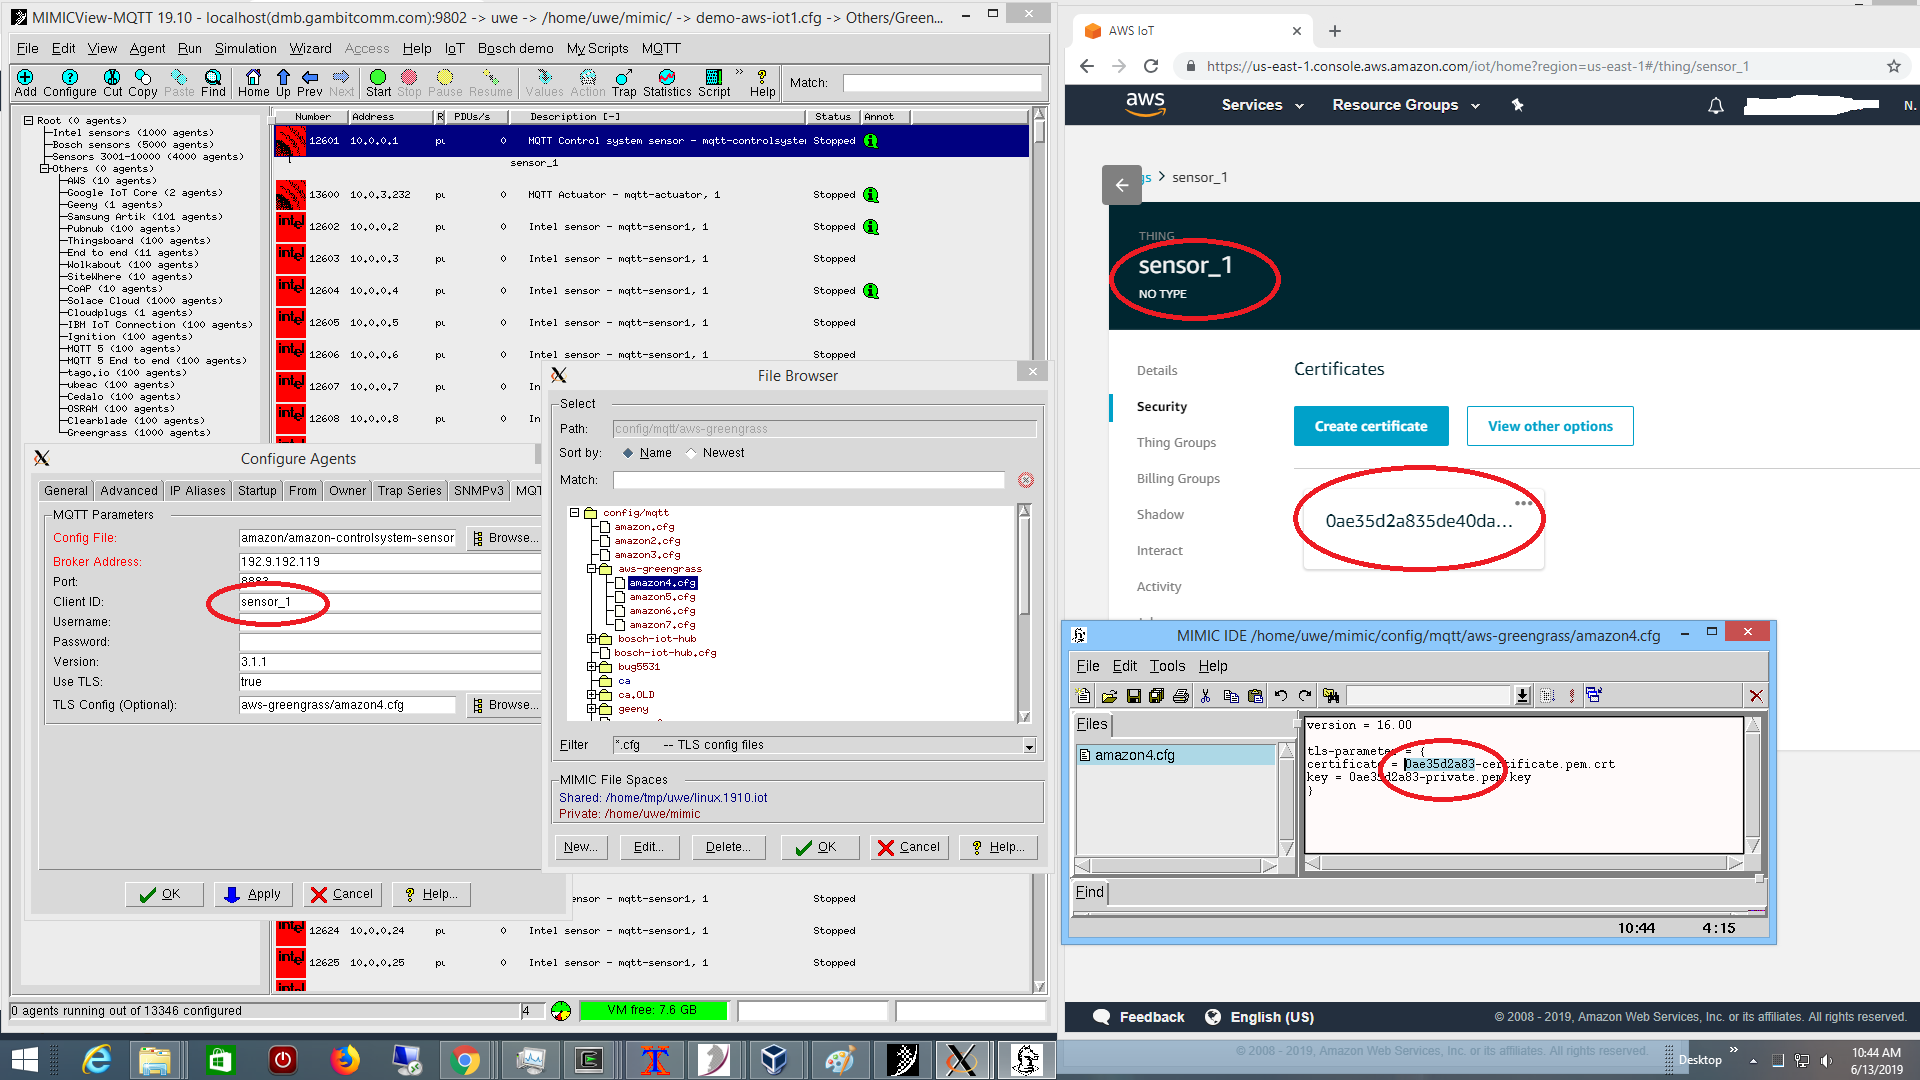
Then we simulated our usual bi-directional simple control system at the edge,
with these devices


including a sensor sensor_1 reporting telemetry to Greengrass core,


running in MIMIC as seen above on the left, with certificates as configured in
AWS on the right.

When the actuator (eg. cooling system) in the control system is off, the sensor
temperature heats, and when it is on, then it cools. 
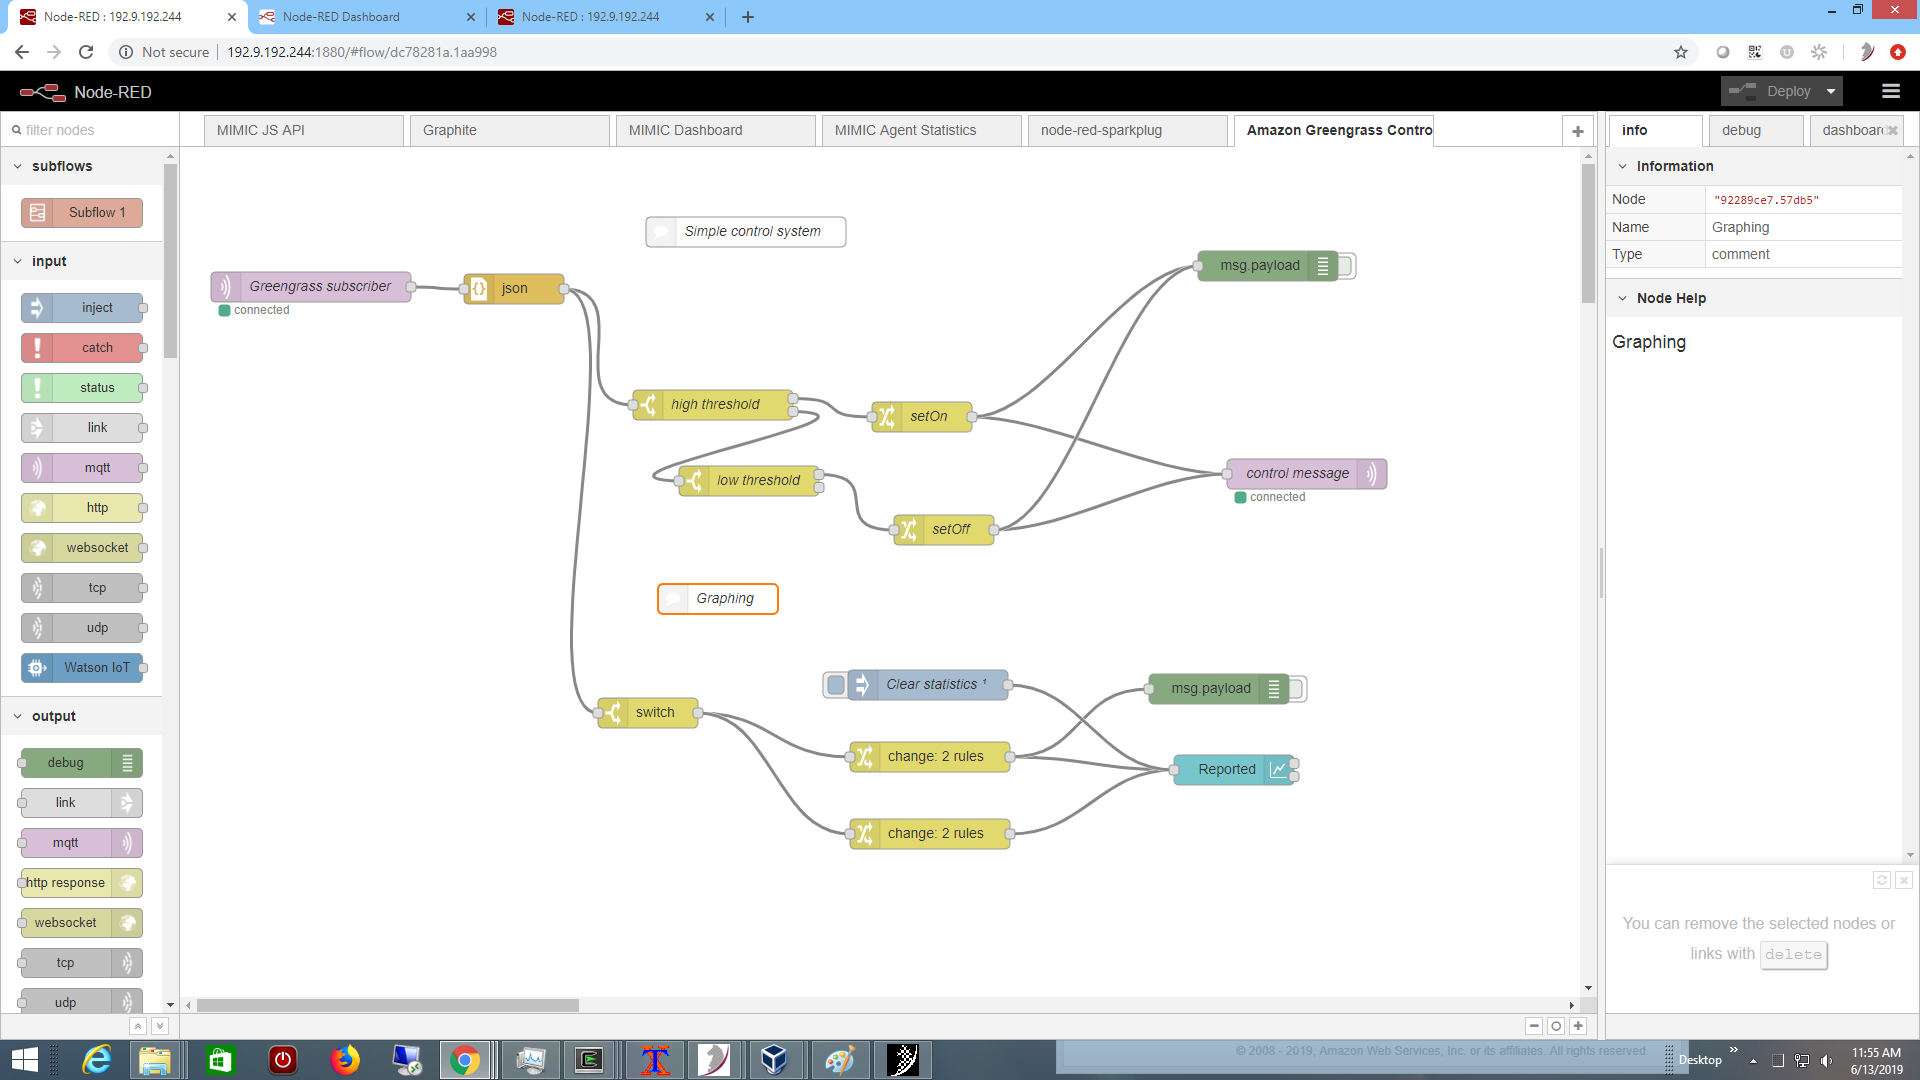
We implemented the control
system logic in a Node-RED flow, rather than in a Lambda function.


It turns the actuator on if the temperature exceeds a high threshold, and turns it
off if the temperature 
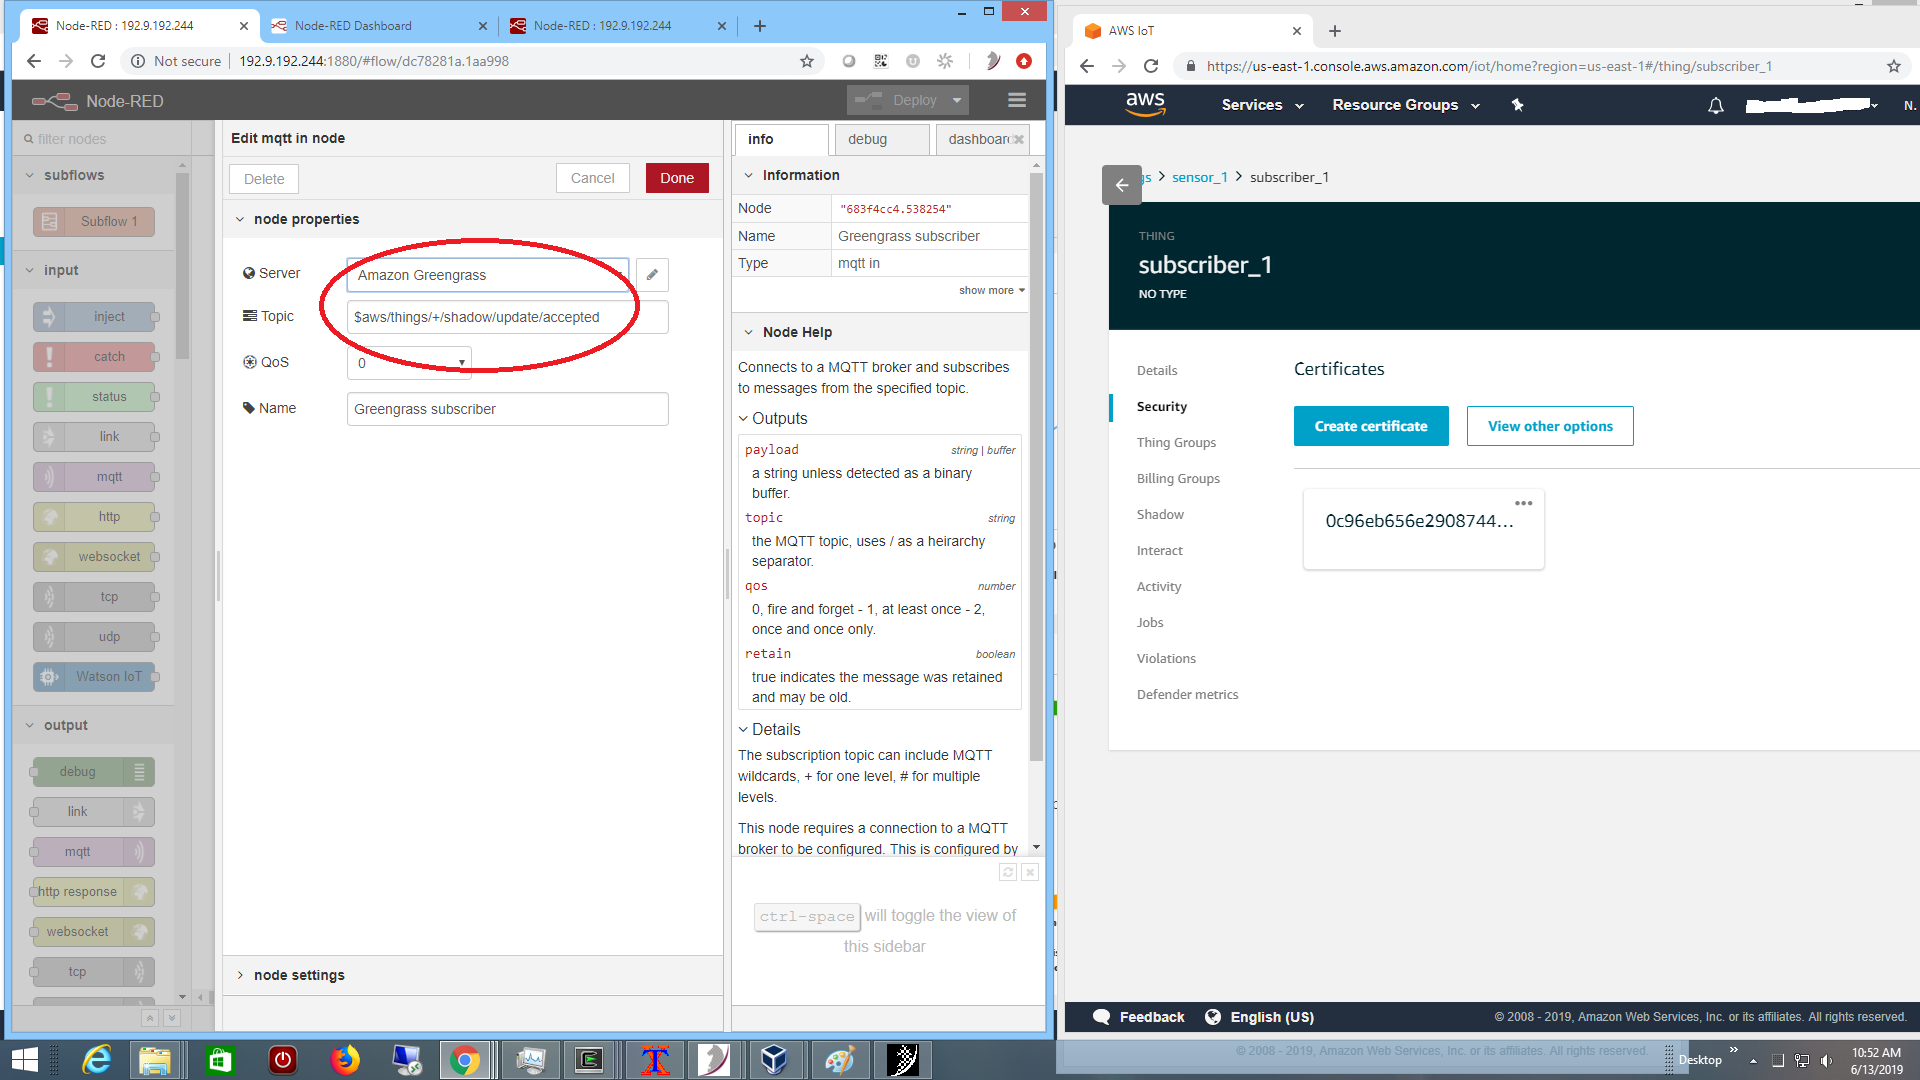
is cool enough. The connectivity to the core broker is setup
as a subscriber to the shadow updates as shown below on the right:


and the Node-RED subscriber is configured to connect to the broker at the edge:


with TLS certificates exported by AWS:


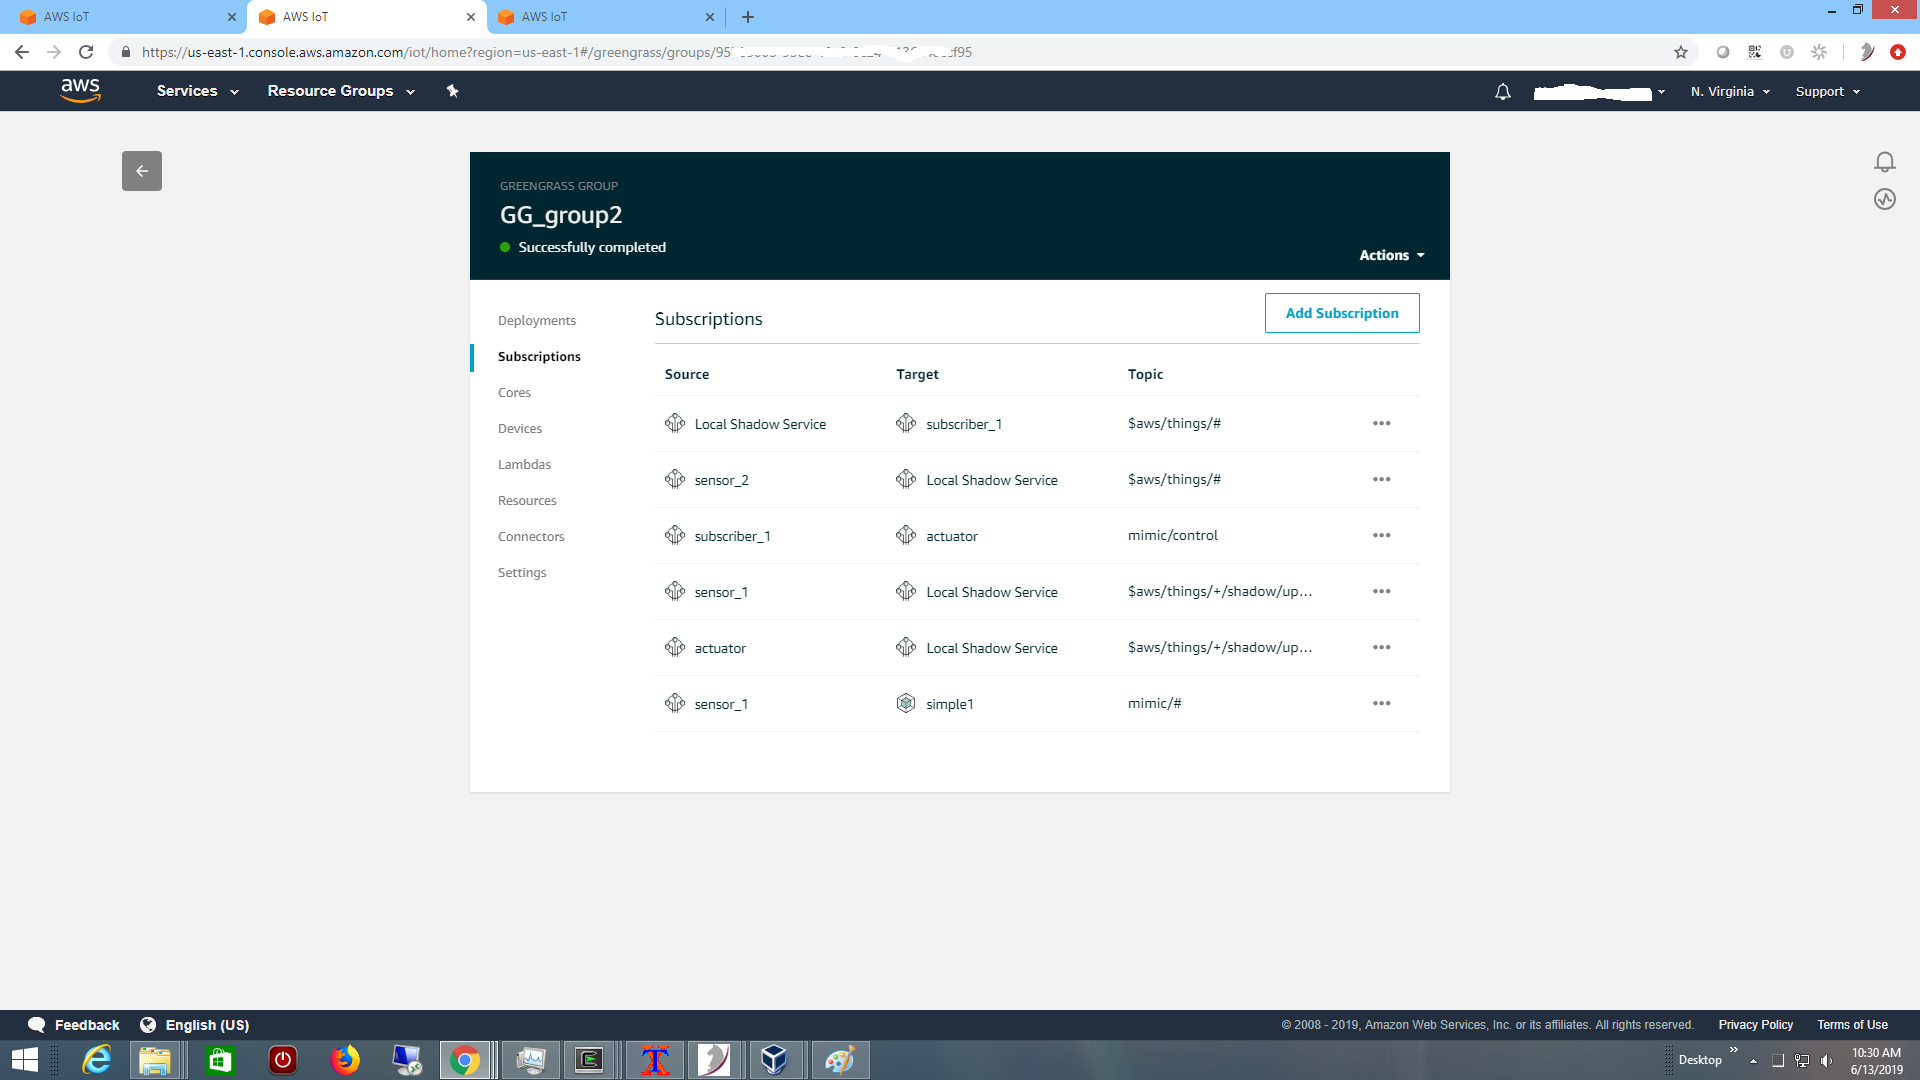
The parts of the system need permission to publish as defined in the Greengrass
subscriptions:


Once everything is setup, the control system reaches a normal steady state at the
edge, as visualized by the Node-RED graphing rules, as shown in this 2-minute
Youtube video.

Conclusion

We saw that by using MIMIC MQTT Simulator we can create a real-time
scalable, predictable, customized IoT Edge Control System scenario that
compresses the state transitions into a period short enough for showing in
less than 3 minutes.

Future work can improve on this to make it more scalable, test exceptions
(eg. what if the sensor does not cool down when fan is on?), test different
implementations (eg. Lambda function vs. Node-RED), etc.


References:

[1] The Hitchhikers Guide to AWS IoT

Monday, June 3, 2019

MIMIC MQTT Simulator driving a IoT demo at Cisco Live

If you are planning to attend Cisco Live next week, take a look at a
dynamic IoT platform demo. You will see a cruise ship with dynamic,
real-time cabin temperature and door lock sensors simulated by
MIMIC MQTT Simulator.

Here you see a drill-down to a particular sensor:


Update 6/12/2019: Here is a tweet to a video at the show.

Friday, May 24, 2019

MIMIC MQTT Simulator: dynamic, scalable device shadows on AWS IoT

This 2-minute Youtube video shows multiple, independent device shadows
updating from MIMIC MQTT Simulator to Amazon AWS IoT with dynamic,
real-time,  predictable, scalable values.

MIMIC allows to quickly create on-demand prototypes and proof-of-concepts for
your particular IoT Application based on AWS IoT device shadows.


Update 12/04/2019:

Our AWS IoT Get Started Tutorial Lab  allows you to get started with
AWS IoT Core in a matter or minutes, learning and experimenting quickly.

Update 2/24/2020:

Here is a video testing AWS IoT Rules.


Monday, May 13, 2019

MIMIC Simulator integrated with Telegraf OSS monitoring application

What better way to quickly develop / test / prototype Telegraf deployments
than with simulated data? MIMIC Simulator delivers the dynamic,
customizable, scalable data for the variety of Telegraf input plugins.

To exercise SNMP interoperability, for this experiment we graph real-time
interface statistics from a simulated Cisco ASR 9000  router.

The graph in Grafana shows ifInOctets SNMP data collected from the MIMIC
simulated Cisco ASR 9000. The data is collected by the Telegraf application
using the SNMP plugin, and output to InfluxDB. Grafana is showing the data
using the InfluxDB as data source.

The Telegraf, InfluxDB and Grafana setup was done using this link:

https://lkhill.com/telegraf-influx-grafana-network-stats/


Monday, April 1, 2019

MIMIC implements MQTT 6

Skipping the latest MQTT 5, MIMIC MQTT Simulator now supports the
yet-to-be-defined MQTT 6 standard.

Happy April Fool's Day!

In all seriousness, MIMIC is the first MQTT 5 simulator to implement the
latest MQTT 5.

Try it out at http://mqttlab.iotsim.io/mqtt5/


Thursday, February 7, 2019

MQTT 5 Testing

MQTT 5.0 is the next version of the ISO standard MQTT 3.1.1 Internet
of Things protocol.

We used the latest version of MIMIC MQTT Simulator to test several MQTT
brokers with MQTT 5 support, and in a short time have discovered some
differences in protocol behavior between them.

Test 1 - CONNECT with Maximum Packet Size set to low value

In the case of 0, one broker disconnects immediately, and the other sends a
CONNACK with Reason Code. In this case, the spec clearly says

It is a Protocol Error to include the Maximum Packet Size more than once,

or for the value to be set to zero.

Both behaviors are legal, since protocol errors must result in disconnect, but
at the discretion of the server it may send a CONNACK with reason code, as
detailed here.

Curiously, if the value is 10, again one broker disconnects immediately, but
the other does not send anything, presumably because the CONNACK would
have violated the limit. This results in a timeout at the client.

Test 2 - PUBLISH with empty topic name and no topic alias

In this case, one broker disconnects and the other sends PUBACK with
Reason Code. In this case, the spec clearly says

It is a Protocol Error if the Topic Name is zero length and there is no Topic Alias.
Protocol errors must result in disconnect as detailed here.

Test 3 - PUBLISH to wildcard topic

For example, to handle the error of a PUBLISH with QOS = 1 to an illegal
wildcard topic, one broker returns a PUBACK with the Reason Code of 0x90,
whereas another returns a DISCONNECT with that Reason Code. This
behavior is expected with QOS 0, but since it is not defined as a protocol
error, for QOS 1 and 2 the PUBACK and PUBREC response should be used.

This is what our logs show:


INFO  02/06.10:58:25 - MQTT[AGT=1] - sent PUBLISH (110 bytes)
INFO  02/06.10:58:25 - MQTT[AGT=1] - rcvd PUBREC rc=0x90 Reason String The topic is not valid: ...

vs.

INFO  02/06.11:01:25 - MQTT[AGT=1] - sent PUBLISH (110 bytes)
INFO  02/06.11:01:25 - MQTT[AGT=1] - rcvd DISCONNECT reason 0x90 (Reason String PUBLISH with wildcard character (#/+) was sent.)

Test 4 - PUBLISH with Payload Format property

For a PUBLISH with property Payload Format set, the spec says

A Server MUST send the Payload Format Indicator unaltered to all
subscribers receiving the Application Message [MQTT-3.3.2-4]

One of the brokers discards the Payload Format Indicator property if it is 0.
If this property is missing, it can be assumed to be 0. While not breaking
anything, this is technically incorrect.

Test 5 - Shared vs. non-shared subscriptions

The new shared subscriptions allow multiple subscribers to receive mutually 
exclusive subsets of the messages of a particular topic filter. This 90-second 
YouTube video illustrates the behavior


Conclusion

Since MQTT 5 is so recent, you need to test many features of your selected
MQTT brokers and IoT applications with different scenarios to mitigate
costly surprises before deployment. MIMIC MQTT Simulator can really help
with that.


Friday, January 11, 2019

Real-time telemetry throttling demo for MQTT.Cool

MQTT.Cool is a web gateway that you put in front of any MQTT broker to
boost its security, performance, and architecture. It allows IoT applications
to connect to your MQTT broker from anywhere on the Internet, even behind
the strictest corporate firewalls and proxies, without sacrificing security.
MQTT.Cool will automatically throttle the data flow for each client, to adapt
to any network congestion. Simply put, MQTT.Cool's unique feature
of optimizing the real-time data flow, rather than forwarding it as a dumb
pipe, is one of the biggest advantages for a Customer's application.

What better way to demonstrate its features than to create an online
demo page that lets you visualize and interact with a sample client?
The open-source client lets you control throttling globally or individually
to see the effect on the data.

The real-time data is generated by MIMIC MQTT Simulator with arbitrary,
customizable, scalable, predictable telemetry. We deployed 10 sensors on
our MQTT Lab to generate a variety of telemetry patterns that is throttled
by MQTT.Cool.


Thursday, January 3, 2019

400,000 MQTT connections to IBM MessageSight for real-time performance testing

As part of our MQTT broker and IoT Platform testing program, we had
previously connected 100,000 simulated connections to IBM MessageSight.

Now, with the latest MIMIC MQTT Simulator 18.10 running in Docker
instances on 2 VirtualBox VMs (16GB RAM and 4 CPUs each), we managed
to start 200,000 simulated sensors connecting to IBM MessageSight 2.0 in
under 15 minutes.

Contrary to the prevailing testing methodologies, where either dummy
MQTT sessions are opened (not doing anything other than maintaining
the session with PING responses), or the vast majority of clients subscribe
rather than publish, each of our clients simulates a sensor publishing
telemetry. To test the actual performance of the topic switching, you can
now add your expected number of subscriber on the expected topic
hierarchies.

With this fast turnaround we can now do timely investigation of the
real-time performance impact of other variables such as:

1) unencrypted vs. TLS

2) varying message frequency

3) varying payload sizes with arbitrary content (JSON, binary, etc)

4) different QOS levels

5) varying topic hierarchies

6) varying subscription levels

7) impact on end-to-end latency

As always, each of the 200,000 sensors can be controlled individually or in
a group in real-time to affect payload contents, payload frequency,
connection status to verify handling of pathological conditions by the
IoT platform.


Update 1/8/2019: We have achieved 300,000 simultaneous connections.
Do you see where this is going?


Update 1/29/2019: We have achieved 400,000 simultaneous connections
on the newly released MessageSight 5.

Update 6/1/2022: MessageSight is now open-sourced as Eclipse Amlen